
Every Lead Scored
Before You Dial.
Yield watches every inbound lead like a combine reads a field — scoring grain buyers, equipment dealers, and co-op procurement managers against live commodity data, seasonal buying patterns, and regional soil reports.

Move the market.
Watch the score move.
Drag the corn futures price slider and see how Yield re-weights this lead's AI confidence score in real time — the same logic that runs on every inbound account.
Every module built
for ag sales cycles.
Click any module to see what your reps would see mid-season — and what they'd miss without it.
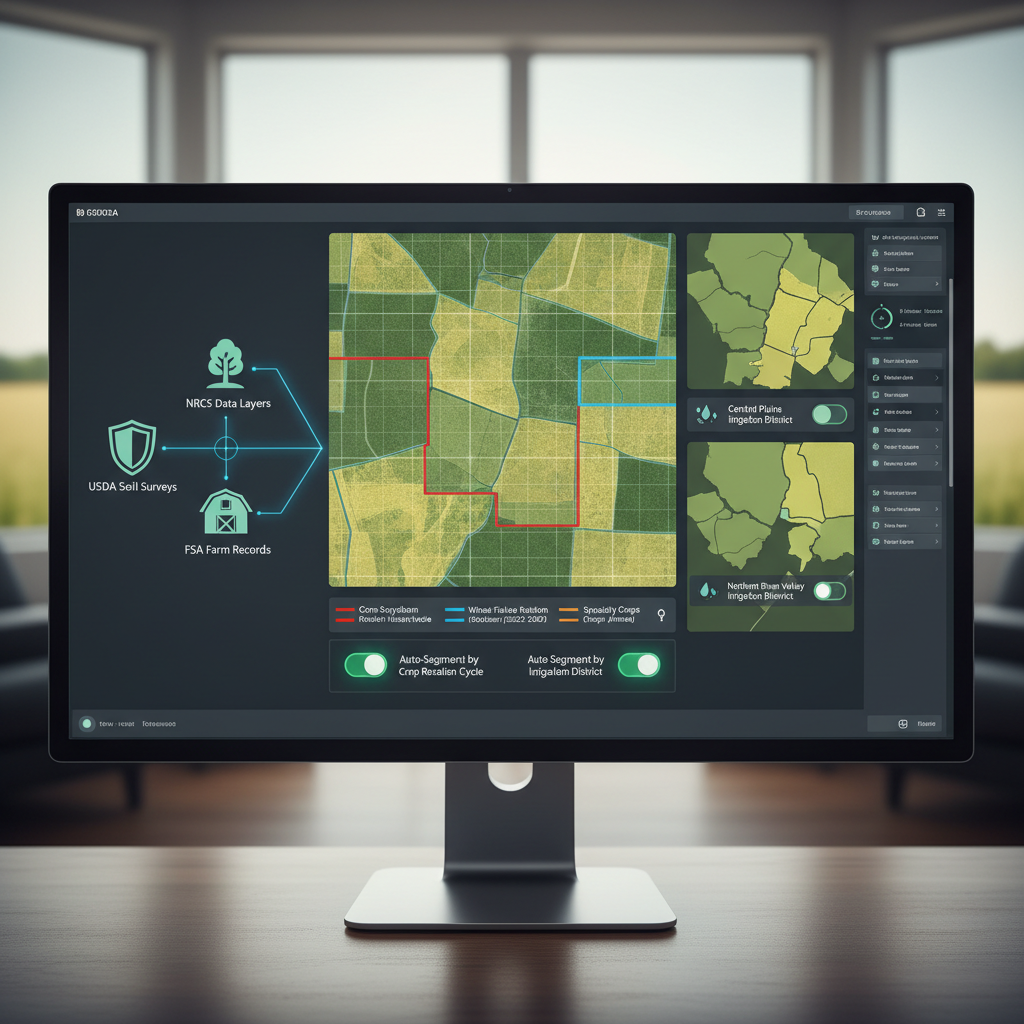
Territory Heat Mapping
Visualize every lead by county, soil type, and commodity exposure. See where your pipeline clusters before you route a single rep.
Seasonal Pipeline Forecast
Your pipeline swells and contracts with the harvest calendar. Yield models planting windows, harvest timelines, and input purchase cycles to surface leads exactly when they're ready to buy.
CRM Sync Status
Scores flow directly into your CRM fields. Reps see the AI confidence score, the top scoring factor, and the recommended call window — all inside the tools they already use.
Live Commodity Influence
When corn moves 8 cents, your lead scores move with it. Yield re-ranks your entire territory pipeline against live CBOT and CME feeds every 6 seconds during market hours.
AI Confidence Explainer
Every score comes with a plain-English explanation of what drove it. No black box. Reps know why a lead is ranked #1 before they pick up the phone.
The model behind
every score.
Four weighted factors. Built by ag sales veterans. Audited quarterly against closed-won deal data. Here's exactly how we score — no black box.
Purchase History Weight
38% weightWe analyze 36 months of order history, average transaction size, product mix, and payment behavior. A buyer who orders $80k of seed every October scores significantly higher than one with a single recent inquiry.
Seasonal Timing Modifier
27% weightAg sales live and die by the calendar. We map each lead against the planting and harvest windows for their specific county and crop rotation — and boost scores when buyers enter their historical purchase window.
Crop-Price Correlation
22% weightWhen commodity prices move, buyer behavior shifts. We model each account's sensitivity to CBOT futures and re-weight scores in real time when their crop's margin window opens or closes.
Engagement Recency Score
13% weightRecent engagement is a leading indicator. Email opens, pricing page visits, demo requests, and CRM interaction timestamps are weighted by recency and combined with behavioral intent signals.
What's slipping through
your territory?
Enter your territory details and see what Yield's AI prioritization would add to your pipeline this season.
No form. No sales call. Sandbox loads in 90 seconds with real ag-sector lead data.
Reps who see the field
before they move.
"I manage 640 accounts across the San Joaquin Valley. Before Yield, I was dialing in the dark. Now I spend the first hour of every morning working the top 12 accounts the model flagged overnight. Close rate went from 14% to 22% in one season."

"The commodity price integration is what sold us. When soybeans moved through $13 last October, Yield auto-flagged 34 accounts that historically buy when margins open. My team closed 11 of them inside 10 days."
"Our reps used to spend 40% of their time deciding who to call. Yield cut that to under 8 minutes per morning. The seasonal timing model alone is worth the subscription — it understands planting windows better than our own ops team did."